 |

|
|
|
|
 Back to 1998 3rd Quarter Table of Contents
Abstract A summary of the conventional biostatistical theory of survival analysis is presented by means of an example from the literature. This is followed by a review of the historical background leading to the development of the Hardin Jones-Pauling biostatistical theory of survival analysis for cancer patients. Then, the salient details of this theory are given, along with the application of the theory to the literature example. The Hardin Jones Principle, which describes the temporal behavior of survival for terminal cancer patients, is elucidated. Three criteria for the validity of clinical trials of treatments of cancer patients based on the Hardin Jones Principle are discussed. Some of the advantages of the Hardin Jones-Pauling theory over the conventional theory are outlined. 1. Introduction In modern medical practice, it is important to provide some sort of answer to the question "For a given illness or group of illnesses, or to promote well being, is a particular treatment (or lack of treatment) more efficacious than one or more other treatments?" Of course, because of biochemical individuality, it is impossible, in general, to provide an answer to this question for a given individual. Therefore, one must resort to statistical analysis and attempt to determine the relative efficacy of treatments in groups of individuals who differ as little as possible from each other. The null hypothesis to be checked is then: There is (or is not) any significant difference in the outcome for different treatments given to groups with nearly identical composition. 1. 521 Del Medio Avenue, #107 Mountain View, CA 94040 e-mail: zelek.herman@forsythe.stanford.edu
An obvious way to initiate the analysis of efficacy of treatment is to plot the outcome as a function of time for the members of a group receiving a given treatment and to compare this plot to those for the members of other groups receiving other treatments (or no treatment at all). Then, one uses the appropriate statistical tests to provide an estimate of the probability that the observed difference in outcome, if any, between the groups is due to chance. Biostatisticians have developed a formal theory for doing this and have given it the name "survival analysis." Furthermore, one of the most popular forms of survival analysis is one in which the number of individuals at risk at a given time is normalized in order to account for individuals having left the study prematurely and for no reason relating to the outcome. This formal treatment is called Kaplan-Meier survival analysis, and medical practitioners and biostatisticians have relied extensively on this treatment to test the efficacy of a given cancer treatment. Nevertheless, there exist certain deficiencies in the Kaplan-Meier treatment insofar as it pertains to survival analysis for cancer patients. Chief among these deficiencies is the inability of the Kaplan-Meier method to answer such questions as "What is the rate of death for the patients in a group receiving a particular treatment?" An alternative to the Kaplan-Meier method that answers this question is the work of Hardin Jones, a medical physicist working at the University of California at Berkeley, published during the middle of this century. Hardin Jones made the important observation that, in general, cancer survival may be approximated as a first-order reaction, a concept familiar to every physicist and chemist. This means that a plot of the logarithm of survival as a function of time is approximately linear. Using the Hardin Jones Principle as a starting point, Linus Pauling and Zelek S. Herman extended the theory in such a way as to provide viable alternatives to the Kaplan-Meier method and to provide criteria for the validity of clinical trials of treatments of cohorts of cancer patients. Finally, Pauling's extensions of the Hardin Jones analysis allow one to predict the lifetimes of different cohorts within a given group. 2. The Kaplan-Meier Product-Limit Estimator for the Survival Function As mentioned previously, the Kaplan-Meier treatment1 takes into account the possibility of subjects leaving the study (through their own volition or death or the volition of the attending physician) by renormalizing the survival function at the time of such an event, which is formally called a "right-censored event." The standard Kaplan-Meier treatment is perhaps best illustrated by means of the following example, which is taken from a standard text in the field, Miller's book on survival analysis.2 The example we shall consider is that of the investigation of the efficacy of maintenance chemotherapy for acute myelogenous leukemia (AML) conducted at Stanford University by Embury et al.3 The group maintained on the chemotherapy consisted of eleven patients (i.e., N = 11), and the number of weeks of complete remission for the members of the maintained group is given by the following values: 9,13,13+, 18, 23, 28+, 31, 34,45+, 48,161+. In this listing, the "+" denotes a right-censored event, and the last value indicates that one patient was still in complete remission at the conclusion of the study. To plot the Survival Distribution Function, denoted by S (t) we need to cal-culate the Kaplan-Meier Product-Limit estimator for this function. The Kaplan-Meier Product-Limit estimator for sur-vival as a function of time is simply cal-culated by multiplying the number of sub-jects at risk times the value of the survival function at the time of the event, with the survival function at time zero having the value 1 (or 100%): 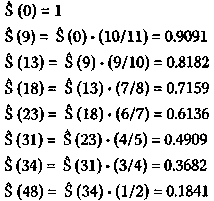
Note that the denominator of the mul-tiplying fraction has decreased by two at 18, 31, and 48 weeks because of right-censored events having just occurred. A plot of the survival function versus time is shown in Figure l(p. 143). The mathematically inclined reader will no doubt observe that S(t) is not a true function but rather a step function. The number of weeks of complete remission for the twelve members (i.e, N= 12) of the non-maintained group is given by the following values: 5, 5,8,8,12,16+, 23,27, 30, 33,43,45. Repeated values indicate that more than one subject is no longer remission free at the indicated week. For this group, the Kaplan-Meier Product-Limit estimator for the survival distribution function is calculated, as previously: 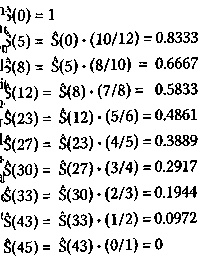
The survival distribution function thus calculated for the non-maintained group is also plotted in Figure 1. After comparing the plots for the maintained and non-maintained groups, it seems at first sight that the results for the former group are better than for the latter. Moreover, from Figure 1, one can easily ascertain that the median survival time (S(t) = 0.5) occurs at 31 weeks for the maintained group and 23 weeks for the non-maintained group. It turns out that one can calculate the average survival times (± standard error) as well; for the maintained group, the average survival time (± standard error) equals 31.84 ± 4.89 weeks and for the non-maintained group, 22.71 ± 4.39 weeks, although the value for the former is biased because the last observation in this group was censored (see below). A number of standard statistical software packages, such as SAS®, SPSS®, and JMP® contain provisions for performing routine Kaplan-Meier survival analyses. An analysis using the JMP software is shown in Table 1 (p. 144) and Figure 2 (p.145). This software also presents results for the probability p that the observed difference between the two groups Figure 1. Kaplan-Meier Product-Limit survival analysis of the study by Embury et al. on the efficacy of maintenance chemotherapy on remission-free survival for patients with acute myelogenous leukemia. The solid line denotes the group on maintenance chemotherapy (cytarabine and 6-thioguanine, two days each month) while the dashed line indicates the group receiving no maintenance chemotherapy. Maintenance Chemotherapy for Acute Myelogenous Leukemia Table 1. The JMP Kaplan-Meier Product-Limit survival analysis of the study by Embl et al.2,3 on the efficacy of maintenance chemotherapy on remission-free survival for pa-tients with acute myelogenous leukemia. 1
is due to chance. For no really good reason, other than historical, a p-value of less than 0.05 (that is, 1 in 20 probability that the difference is due to chance) is usually ascribed as having statistical significance. In the Kaplan-Meier survival analysis, there are different ways of calculating the p-value, such as the log rank or Wilcoxon methods, whose detail we shall not discuss other than to mention that the former places more weight on larger survival times while the latter places more weight on early survival times.4 For the example of maintenance chemotherapy for acute myelogenous leukemia, the following values are obtained: p (log rank) = 0.0653 p(Wilcoxon) = 0.0989 or, taking the average of these two values P average = 0.0821. Thus, according to the conventional
analysis, one would have to say that this study, while showing somewhat longer
com-plete remission times for the maintained group than for the non-maintained
group, is on the efficacy of maintenance
chemotherapy on remission-free survival for patients with acute myelogenous
leukemia.
Figure 2. The JMP Kaplan-Meier
Product-Limit survival analysis of the study by Embury et al. 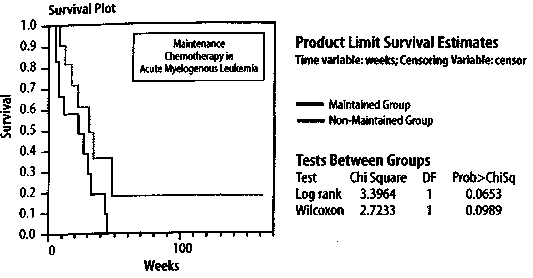
of marginal statistical significance. This find-ing, coupled with the fact that chemotherapy is often associated with significant side ef-fects, makes it difficult for a statistician to recommend, based solely on the results of this study, chemotherapy for the type of pa-tients suffering from acute myelogenous leukemia that were included in this study, Nevertheless, it is entirely possible that a clinical trial using a greater number of pa- tients would have produced results with greater significance (i.e., a smaller p-value). Indeed, for a given effect, increasing the number of patients will always decrease the p-value. A particularly troubling feature in the results obtained by Embury et al. is that there is one patient in the maintained group whose remission-free survival is much longer (161+ weeks) than any of the other patients in either group. It is quite possible that this patient is an outlier, and if so, should be excluded from the analysis. Statisticians have developed tests for outliers at a particular level of significance. One of these is called Dixon's Q-test.5 According to Dixon's Q-test, the Q-value for sample size N = x is determined by: 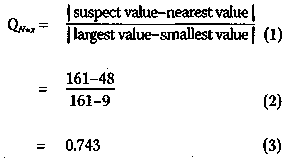
However, from a table of the critical values of Q (e. g., ref. 5, p. 218), we find that, at the p = 0.05 significance level, Q N=11 (p = 0.05) is less than (<) 0.464. Since 0.743 is greater than (>) 0.464, the patient with remission-free survival time 161+ weeks is an outlier at the p = 0.05 significance level. In fact, Dixon's Q-test can be employed to show that this patient is an outlier at the p = 0.01 significance level (that is, 1 in 100 probability that the finding is due to chance). It should be pointed out that neither Embury nor Miller considered this patient to be an outlier. One of the salient features of the Hardin Jones-Pauling biostatistical theory is that it can deal in a simple manner with the possibility of outliers (see below). 3. The Hardin Jones Biostatistical Theory of Survival Analysis for Cancer Patients 3.1 First-order reactions In chemistry and physics, one often encounters reactions characterized by the fact that the rate at which the reaction proceeds depends only on the amount of one reacting material. Such a reaction is called a "first-order reaction". An archetypal first-order reaction is that of alpha-particle radioactive decay. Mathematically, a first-order reaction can be expressed as where A(t) is the amount of material A at time t and k is the first-order rate constant. The derivative dA/(t)=dt expresses the instantaneous rate of change in the amount of the material A as a function of time t. Since A: is a constant, independent of time, equation (4) can be integrated to obtain A(t) = A(0) exp(-kt), (5) wherein A(0) is the amount of material A at time equal to zero. Equation (5) can be rearranged to A(t)/A(0) = exp(-kt) (6) Taking the natural logarithm, ln, of both sides of equation (6) yields ln[A(t)/A(0)] = -kt, (7) which implies that a graph of the natural logarithm of A{t) as a function of time will be a straight line with slope equal to -k and ordinate intercept at t = 0. Moreover, a first-order reaction has a characteristic half-time (or half-life), t1/2, at which time half of the starting material has been used up. This occurs when A(t = t1/2) = 0.5 A(0). Putting this expression into equation (7) yields immediately that 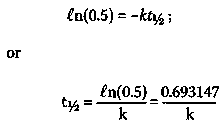
Thus, a first-order reaction is charac- terized by two quantities: (1) the rate k of the reaction; and (2) the half-life t1/2 at which time half of the starting material has been depleted. It is important to recognize that, if one does not change the conditions of the reaction, both of these quantities are independent of the time when one starts measuring the amount of A, that is, half of the material is used up after a time interval equal to t1/2.
3.2 Reinventing the wheel-The Hardin Jonesanalysis of cancer survival. In the spring of 1984, during the era when computer users utilized computer terminals attached to a mainframe compu- ter, I was sitting in the computer room at the Linus Pauling Institute of Science and Medicine, located in Palo Alto, California, next to Dr. Ewan Cameron, a Scottish sur- geon and retired colonel in the Medical Corps of the British Army, who was then a Research Professor at the Linus Pauling In- stitute. In the prior decade, Dr. Cameron and his associates in Scotland had studied the efficacy of vitamin C (L-ascorbic acid) in extending the lifetimes of patients hav- ing various types of cancer. They treated patients with vitamin C, sometimes in con- junction with conventional therapy, and then compared the results with those for historical controls that been selected by an independent and unbiased person.6 146 The Hardin Jones-Pauling Biostatistical Theory of Survival Analysis for Cancer Patients At that time, I was a Research Associ-ate at the Linus Pauling Institute working as the collaborator of Professor Linus Pauling, assisting him in his research concerning the nature of the chemical bond. While I had come to the Linus Pauling In-stitute in 1980 from the Stanford University Medical Center, where I had done theoretical work regarding the bonding of oxygen to hemoglobin (a field started by Linus Pauling and his colleagues at the California Institute of Technology in the 1930s), my academic training was in the somewhat ar-cane field known as quantum chemistry Nevertheless, on that fine spring day in 1984, while sitting in the computer room of the Linus Pauling Institute next to my colleague and dear friend Ewan Cameron, I had the idea that, for a given type of cancer and treatment, patient survival might fall into one of three possible categories: 1. If the patients' defense mechanisms against cancer were all the same, then their survival times would depend only on the number of surviving patients at any given time, as in a first-order reaction. 2. There are essentially only two kinds of patients: (a) those who have a poor genetic defense against the malignancy (one first-order reaction with a relatively large rate constant); and (b) those patients who have a better genetic defense mechanism against the malignancy (another first-order reaction with a lesser value of the rate constant). 3. All patients have different genetic mechanisms to defend them against the particular kind of cancer while undergoing a particular treatment, so that a plot of the loga-rithm of the survival function as a function of time would be a curve with a negative slope that decreases with increasing time. My gut feeling was either scenario 1 or 2 would prevail, and I asked Dr. Cameron if I could use his results to test my theory. His response was, as expected, in the affirmative. If survival for a given type of cancer and particular therapy is, indeed, a first-order reaction (scenario 1), then the mathematical treatment begins, as before, with the rate of change in the survival function S(t), as calculated from the Kaplan-Meier theory, as a function with the form where k is again the rate constant (or rate-of-death constant). Integrating equation (10) leads to where S(0) is the value of the Kaplan-Meier Product-Limit survival function at time zero. Taking the natural logarithm of both sides of equation (11) results in Since the logarithm of a quotient equals the difference of the logarithms of the dividend and the divisor, equation (12) may be rewritten as ln S(t) = ln S(0)-kt, which is the equation of a straight line with slope -k and ordinate intercept S(0). Thus, a graph of the natural logarithm of the Kaplan-Meier Product-Limit survival function S(t) as a function of time will be a straight line with slope equal to -k and ordinate intercept S(0) at t=0. Furthermore, half of the patients will be alive (i.e., S{t1/2) = 0.5 S(0)) at time equal to t1/2 (the half-life), or If cancer survival is, in fact, well approximated as a first-order reaction, then analysis of the survival in terms of this theory has several distinct advantages over the conventional analysis described in the previous section. One of these relates to the ubiquitious question asked the doctor by the patient, "Doctor, how long can I expect to live?" In the conventional analysis, no doctor can honestly answer this question, except to say, "I do not know" or "The only thing that I can say is that the mean survival time is approximately such and such." If, however, the survival is a first-order reaction, then the physician can answer the patient's question with certainty by stating the death rate and the half-life. If the survival is described by scenario 2, then one has the situation in which the survival function is well approximated by the sum of two first-order reaction curves, with independent rate constants k1 and k2. The detailed analysis of this second scenario is discussed later on. I tested Dr. Cameron's results for patients suffering from at least one dozen different types of cancer and either being treated with vitamin C (sometimes in conjunction with conventional treatment) or being historical controls given identical (conventional) treatment but without supplemental ascorbate. I found that, in every case, the survival of both the vitamin-C patients and the historical controls could be very well approximated either as a single first-order reaction (scenario 1) or the sum of two first-order reactions (scenario 2). Two examples of these analyses on patients with incurable lung cancer and with incurable stomach cancer are shown in Figure 3 and Figure 4, respectively (p. 149). In Figure 3, it is seen that, for the 240 control patients with incurable lung cancer, survival is a first-order reaction, while for the 51 vitamin-C patients, the survival may be approximately described as the sum of two first-order reactions. In contrast to this *When I realized that I had reinvented the wheel, I remembered a discovery that I had made as an undergraduate while studying philosophy, namely, that Aristotle's statement in his Nichomachean Ethics that "There is nothing new under the sun" had, in fact, appeared in Ecclesiastes 1:9, which was written by King Solomon approximately 600 years before Aristotle lived. **In a book published in 1986, Pauling employed the Gompertz treatment to analyze human mortality in the United States.12 situation, it is found for the case of incur-able stomach cancer (Figure 4) that the op-posite situation prevails, namely, the sur-vival for the 136 control patients is well ap-proximated by the sum of two first-order reactions whereas the vitamin-C group, with patients, is a single first-order reaction. For the case of incurable stomach cancer, it is also seen that the initial death rate is less for the vitamin-C patients than for those in the control group. When I completed this analysis of Cameron's data, I literally ran into Linus Pauling's office and said to him that I had made the most important scientific discov-ery of my life. After I showed the analysis to him, he agreed that it was, indeed, a very important discovery, but he also reminded me that Benjamin Gompertz had developed a similar analysis for investigating longevity in general. Gompertz published his first pa-per on this subject in 1820,7 a second one in 1825,8 and a final paper in 1862,9 42 years fol-lowing the publication of his first paper! Professor Pauling also informed me that Hardin B.Jones of the University of Califor-nia at Berkeley had applied a semilogarithmic analysis to cancer survival in 195610 and that P. R.J. Burch, a professor in the Department of Medical Physics at the University of Leeds in England, had also done so in a book pub-lished in 1976.11*Nevertheless, Pauling thought the idea was certainly worthy of in-vestigation and further development, some-thing which we did over the next few years, as described later herein.** When I summa-rized my discussion with Professor Pauling for Dr. Cameron, he asked me to refrain from publishing my analysis of his data until he himself had published a conventional analy-sis of it using the treatment described in Sec-tion 2 above. (Dr. Cameron was quite aware of the the conservative nature of the medi-cal establishment.) Unfortunately, his manu-script was rejected repeatedly by the New England Journal of Medicine, and Dr. Cameron's conventional analysis was only published, in part, posthumously.13 Figure 3. The natural logarithm of the Kaplan-Meier Product-Limit survival estimator as a function of time for patients with incurable lung cancer from the unpublished data of Dr. Ewan Cameron. + = vitamin C ("ascorbate") group (51 patients); o = historical control group (240 patients). (See text for details.) Incurable Lung Cancer 
Figure 4. The natural logarithm of the Kaplan-Meier Product-Limit survival estimator as a function of time for patients with incurable stomach cancer for the unpublished data of Dr. Ewan Cameron. + = vitamin C ("ascorbate") group (19 patients); o = historical control group (136 patients). (See text for details.) Incurable Stomach Cancer 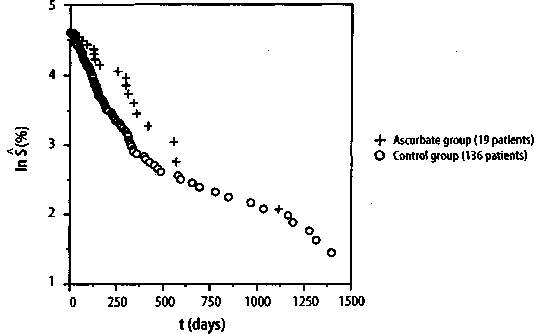
149 Journal of Orthomolecular Medicine Vol. 13, No. 3,1998 3.3 The Hardin Jones Principle Because of Hardin Jones' penetrating analysis of the demography of the cancer problem as a first-order reaction, Linus Pauling and I decided to call the analysis described by equations (11)-(13) the Hardin Jones Principle. According to the Hardin Jones Principle, a reasonably homogeneous cohort of cancer patients, such as those with the same kind of primary cancer who have reached the terminal or untreatable stage and who have been given the same kind of treatment, the rate of death is given by equation. The number of persons dying in unit time is a constant fraction of the number of survivors in the cohort, independent of the time. If, for some reason, patients leave the study or die for a reason that cannot be ascribed to the cancer, renormalization according to the Kaplan-Meier method1 is done prior to making a semilogarithmic plot of the survival function as a function of time. To illustrate the analysis of cancer mortality employing the Hardin Jones Principle, we return to Miller's example of maintenance chemotherapy for acute myelogenous leukemia.2-3 In this case, the survival analysis is not concerned with the time of death of the patients, but rather with the cessation of remission-free survival. In Figure 5, (p.151) the common logarithm* of the values of the Kaplan-Meier Product-Limit survival function S (as given in Section 2) are plotted as a function of time. While it is obvious from this figure that the points for the non-maintained group approximately form a straight line, those for the maintained group do not because of the point at t = 161 weeks. Indeed, it has already been shown using Dixon's Q-test for outliers that this point corresponds to an outlier at the p = 0.01 significance level. In Figure 6, (p.151) * The natural logarithm of a number is related to the common logarithm by a simple multiplicative factor: ln(x) = ln (10) log(x) = 2.3026 log(x). ** The astute will observe that the point for t = 45 weeks has been eliminated because log(0) = - °° However, this point can be dealt with in a more sophisticated treatment (see below). the common logarithm of the Kaplan-Meier Product-Limit survival function S is plot-ted as a function time for both the main-tain and non-maintained groups, but with the point for the t = 161+ weeks patient in the maintained group now eliminated.**It is clear from this figure that the set of points corresponding to each group is fairly linear. The lines drawn for each group are the re-suit of a linear least-squares curve fitting procedure, with R being the correlation co-efficient; when the value of the correlation coefficient squared has a value near 1, there is a high correlation between the two vari-ables fitted to a straight line. This is the case for both the maintained group and the non maintained group. For the maintained group, the equation of the straight line is given by Converting this equation to the natu-ral logarithm yields 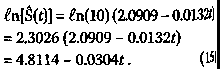
Then, according to equations (13) and (14), the rate constant k, corresponding to the cessation of remission-free survival is given by kmaintained = 0.0304/week, (16) and the average survival time t1/2 has the value 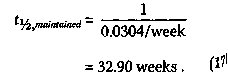
Similarly, for the non-maintained group, the equation for the straight line is given by 150 The Hardin Jones-Pauling Biostatistical Theory of Survival Analysis for Cancer Patients Figure 5. Semilogarithmic plot of the Kaplan-Meier Product-Limit remission-free survival function as a function of time for the study by Embury et al.2,3 on the efficacy of maintenance chemotherapy (cytarabine and 6-thioguanine, two days each month). Maintenance Chemotherapy for Acute Myelogenous Leukemia 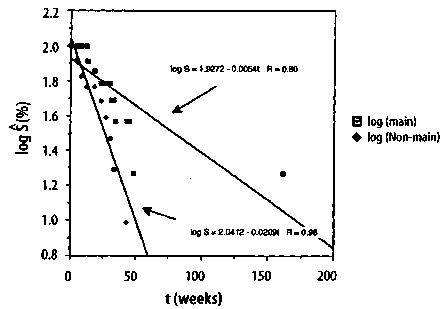
Figure 6. Semilogarithmic plot of the Kaplan-Meier Product-Limit remission-free survival function as a function of time for the study by Embury et al.23 on the efficacy of maintenance chemotherapy (cytarabine and 6-thioguanine, two days each month) on remission-free survival for patients. The outlier patient (p= 0.01) in the maintained group has been omitted. Maintenance Chemotherapy for Acute Myelogenous Leukemia 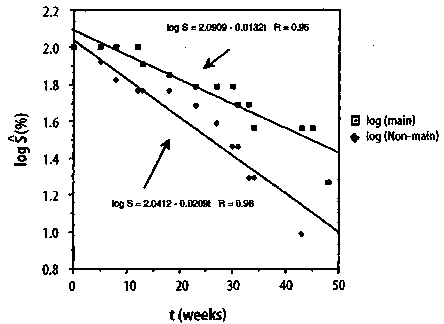
151 Journal of Orthomolecular Medicine Vol. 13, No. 3,1998 The ratio of the rates for the cessation of remission-free survival indicates the value of maintenance chemotherapy for the patients with acute myelogenous leukemia and is given by 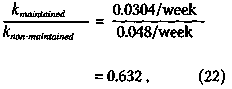
indicating that the rate for the cessation of remission-free survival associated with the patients given maintenance chemotherapy is only 63% of that for the patients in the non-maintained group. Finally, using a statistical test known as the F-test,14 which will not be discussed here, except to mention that it involves testing whether the data in Figure 6 can better be fitted by one line or by the two lines Converting this equation to the natural logarithm yields 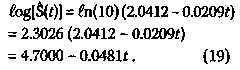
This implies that the rate constant k, corresponding to the cessation of remission-free survival is given by k non-maintained = 0.0481/week , (20) and the average survival time t1/2 is 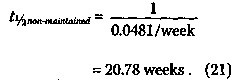
shown, it is possible to obtain the p-value corresponding to the level of significance for the efficacy, at least in this clini-cal trial, of maintenance chemotherapy for acute myelogenous leukemia. The p-value so obtained is 0.051, indicating that the ob-served 37% lower rate for the cessation of remission-free survival in the maintained group has 1 in 20 odds of occurring due to chance. As mentioned earlier, a p-value of 0.05 or less usually means that the study has statistical significance. It is possible to introduce more rigor into the foregoing analysis by weighting the points in the curve-fitting procedure ac-cording to the number of patients at risk for each event. Also, one can use the midpoints of the vertical distances between two values of S(t)at a given time. This latter approach converts S(t) into a true function and allows for the consideration of the time at which the last patient in the cohort dies, if all patients in the cohort die from the cancer. Neither of these approaches will not be dealt with here. 4. The Hardin Jones-Pauling Biostatistical Theory of Survival Analysis for Cohorts of Cancer Patients 4.1 Pauling's theory of survival analysis based on the Hardin Jones Principle According to the Hardin Jones Principle, for a homogeneous cohort of cancer patients, a graph of the logarithm of the fractions of patients surviving as a function of time has a constant slope. As demonstrated in the preceding section, the application of this principle to survival analysis provides a relatively simple method for the statistical investigation of the efficacy of a particular treatment for patients with a given type of cancer. Based on his principle, Hardin Jones10 reported the results of his analysis for about 50 sets of mortality data for cohorts of cancer patients, and Burch11 pre-sented similar analyses for nine sets of data. An example from Burch's book for the loga-rithm of the percent survival of 5,159 California women of all ages with localized breast cancer is given in Figure 7(p.l54). A further example (shown in Figure 8, p.154) from Burch's book shows the application of the Hardin Jones Principle to a case where the cohort is heterogeneous, necessitating the resolution of the logarithm of the survival percentage into two negative exponential functions. Linus Pauling and I have made many similar analyses of the survival data for presumably homogeneous cohorts of cancer patients, thus substantiating the general validity of the Hardin Jones Principle. Since the Hardin Jones Principle provides a sound basis for the investigation of cancer mortality, Linus Pauling was prompted to develop a powerful method of biostatistical analysis of the observed survival times of cancer patients on the basis of this principle.15 I have given this method, which is summarized in the following, the appellation "The Hardin Jones-Pauling Biostatistical Theory of Survival Analysis of Cancer Patients." First, we consider the problem of evaluating the mean value of powers of survival times for a homogeneous cohort of cancer patients. The mean value,* denoted by < tn >, of the n-th power of the survival time t for a homogeneous cohort is obtained by integrating the product of tn and the fraction -dS/dt of patients dying between times t and t + dt, or 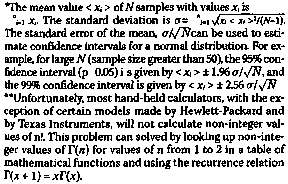
This definite integral can be evaluated and has the value 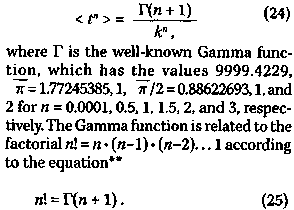
From equation (25), it is seen that the mean < t > is equal to 1/k. We shall denote 1/ k by the Greek letter symbol tau (r). It follows from equations (24) and (25) that 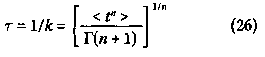
where 1/n denotes the n-th root. This equation is valid for every positive value of n for a homogeneous cohort of patients distributed such that the survival function obeys equation (11). Therefore, we can calculate the mean survival time r according to either of the following two equations 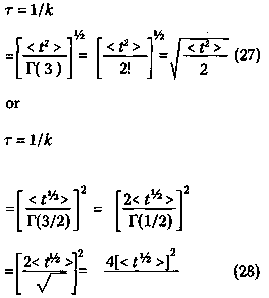
153 Journal of Orthomolecular Medicine Vol. 13, No. 3,1998 Figure 7. Logarithm of the percent survival of 5,159 California women of all ages with localized breast cancer; t1/2 = 18.0 years (after [11]). Logarithm of % Survival of 5159 California Women with Localized Breast cancer 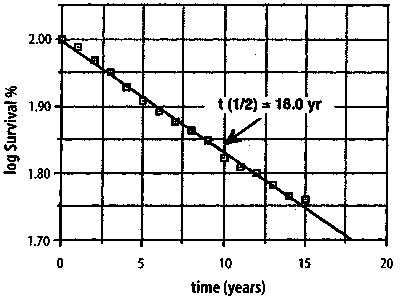
Figure 8. Logarithm of the percent survival of 13,392 California women of all ages with breast cancer of all degrees of severity, roughly resolved into two negative exponential functions, one with t1/2 = 1.7 years and the other with t1/2 = 16.6 years (after [11]). Logarithm of % Survival of 13392 California Women with Localized Breast cancer 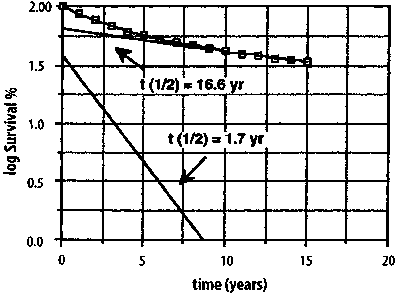
154 The Hardin Jones-Pauling Biostatistical Theory of Survival Analysis for Cancer Patients A third convenient method for evaluating r is to make use of the definite integral 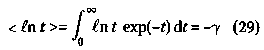
where 7 (Greek lower case gamma) is the Euler-Mascheroni constant, This means that 7 can be calculated according to the equation The fourth, and final, method to estimate r is from the slope of the semilogarithmic plot of the Kaplan-Meier Product-Limit survival function S as a function of time t, or t1/2 = 0.693147/k. (32) If no right-censored events occur, t1/2is merely < t >. Since the causes of error (which decrease with increasing sample size) have different effects in the four methods, the mean of the four values provides a better approximation to the mean survival time r than does any one value. Therefore, 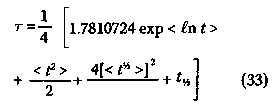
For N0 members in a cohort at the beginning of the trial, the mean deviation from 0 is somewhat less than 1/No 4.2 An alternative to the Kaplan-Meier renormalization procedure for right-censored events In the Kaplan-Meier renormalization procedure,1 the number of patients at risk is decreased by one when a right-censored events occurs, i.e., a member of the cohort changes treatment, drops out, dies for a reason unrelated to the malignancy, or for some other reason can no longer be considered to be a member of the cohort. Unfortunately, valuable information may be lost in this procedure if the number of right-censored events is relatively large, especially if they occur at large values of t. However, the Hardin Jones Principle can be employed to estimate the probable survival time for a right-censored event. If the event is for a member of a homogeneous cohort, then the value of the survival time t' for this patient is given by the equation t' = t + r (34) in which t is the time of the right-censored event and r is the mean survival time of the cohort. For a cohort consisting of No total members, with No+ right-censored events during the course of the trial, a first approximation to r is given by r0 T0=<ti + ti+>; (35) the mean value of tt and ti+. Then the self-consistent value of r is given by the following equation: The estimated value of ti for each right-censored event is given by adding this value of r to each ti+, according to equation (33). These values of ti, and those of ti, can then be employed in equation (32) to derive a value of the mean survival time r. 4.3 A subcohort with a single member In the case of a subcohort with a single member, with survival time t, the probability of survival is exp(-t/r), based on the Hardin Jones Principle. When t/r 155 Journal of Orthomolecular Medicine Vol. 13, No. 3,1998 is equal to 0.693147, this probability is 1/2. Therefore, the mean survival time is equal to r, and r = t. (37) 4.4 A single outlier If the sole member of the subcohort is still surviving at time t+, then the probable median value of the expected lifetime t' is t+ + 0.693147r. Inserting this expression into equation (36) yields r = t+ + 0.693147 r, (38) or r= 3.258891 t+. (39) This is the probable survival time for the single outlier. Thus, the Hardin Jones-Pauling biostatistical theory provides a simple way of estimating this value. 4.5 A cohort consisting of two homogeneous subcohorts For a cohort consisting of two homogeneous subcohorts, with fractions fl and f2 and mean survival times r1 and r2, respectively, the mean probable additional survival time of a survivor is r= f1r1 exp(-t+/r1) +f2r2 exp(-t/r2) f1exp(-t/r1)+f2exp(-t/r2). Values of f1, f2, t1 and r2 are to be obtained in a self-consistent manner by consideration of all values of t, including the predicted values for the survivors, as given by equation (38). If there are N0+ survivors, with survival times greater than ti+, and N0-N0+ others, with known survival times ti, the value of r1 for the latter subcohort is taken to be r1= < ti >. The quantity exp(-r/r1) is then calculated for each ti and assumed to be the probability that this patient is a member of the first subcohort. The value of r2 is evaluated from equation (38), with No+ decreased by subtracting S exp(-t+/r1). The values of t'i for the surviving patients are found from the equation r = t+ + 0.693147 r. (41) An alternative to this procedure is to make a least-squares fit to all the points on a Hardin Jones plot with a two-term exponential function, as shown in Figure 8. 4.6 An example To illustrate the Hardin Jones-Pauling survival theory, we return to the investigation by Embury et al." of the effectiveness of maintenance chemotherapy on remission-free survival for patients with acute myelogenous leukemia. In Table 2, (p. 157) the analysis is presented for the maintained group. As discussed earlier, the patient with t = 161+ is an outlier and will be treated separately. For the remainder of the maintained patients, N0+ = 3, NO = 10 and r0, the mean of ti and ti+, equals 26.20 weeks, according to equation (34). The value of r is computed from equation (35): r = 26.20/(1 - 3/10) weeks = 37.42857 weeks. In column one of Table 2, t is the remission-free survival time of the non-censored patients, and in column two, t+ is the time of right-censored events. In column 3, t' is the actual remission-free survival time for the non-censored patients or the remission-free survival time estimated using equation (33) for the right-censored patients. The remaining three columns list the calculated values of (t')2, (t')1/2, and in t' respectively. The mean values are given at the end of the columns. r is the average value of these means and is given by equation (32), or t= 37.42857+30.93736+43.18707+54.08297 ----------------------------------------------weeks 4 = 41.40899 ± 3.10532 weeks . (42) where the ± value denotes the standard error of the mean. The mean deviation from the mean is 7.22603 weeks, or about 156 The Hardin Jones-Pauling Biostatistical Theory of Survival Analysis for Cancer Patients Table 2,Hardin Jones-Pauling survival analysis of the maintained patients in the study by Embury et al.23 on the efficacy of maintenance chemotherapy on remission-free survival for patients with acute myelogenous leukemia. rO = < ti + ti+> = 26.2 weeks; N0= 3; NO+ = 10; t = 26.20/(1 - 3/10) weeks = 37.42857 weeks t'= t+ + r if censored, =t, otherwise. All values of t are in weeks. 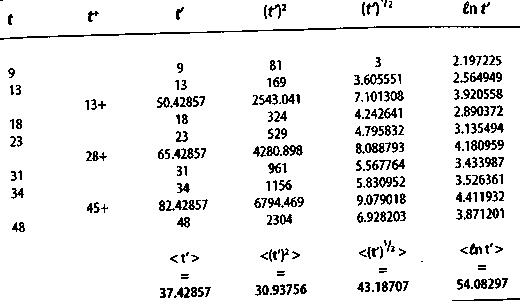
Table 3. Hardin Jones-Pauling survival analysis of the non-maintained patients in the study by Embury et al.2 3 on the efficacy of maintenance chemotherapy on remission-free survival for patients with acute myelogenous leukemia. r0= < ti +ti+> - 21.25 weeks; N0= 1; N0+ = 12; r = 21.25/(1 -1/12) weeks = 23.18182 weeks; t'= t+ + r if censored, =t, otherwise. All values of t are in weeks. 
157 Journal of Orthomolecular Medicine Vol. 13, No. 3,1998 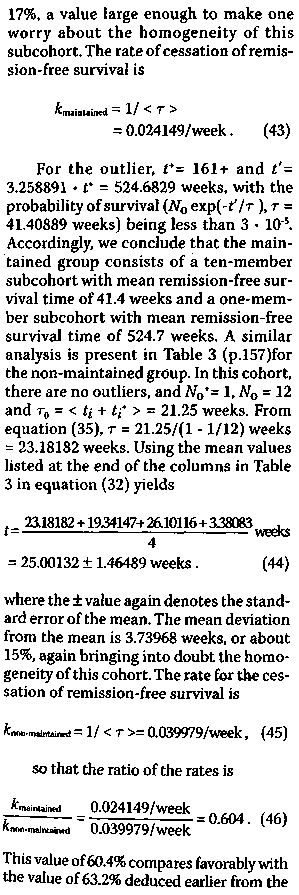
ratio of the slopes of the semilogarithmic plots of survival versus time for the maintained and non-maintained groups. The apparent lack of homogeneity will be commented upon in the next section. 5. Criteria for the Validity of Ginical Trials of Treatments of Cohorts of Cancer Patients Based on the Hardin Jones Principle Using as a starting point the Hardin Jones Principle that the death rate of members of a homogeneous cohort of cancer patients is constant, Linus Pauling and I were able to formulate three criteria for the validity of clinical trials of cancer patients.16 5.1 The first criterion In order to increase the significance of the study, the cohort should be reasonably homogeneous so that the semilogarithmic analysis of the survival data can be done. Moreover, the treatment of all of the members of the cohort should be the same, and it should be continuous and unchanged from the time t = 0 when the patient enters the trial until the time t when the patient dies or t+ when, without dying from the malignancy, the patient is withdrawn from the set of survivors at risk. Any patient who stops the treatment, changes the treatment, or dies from a cause unrelated to the malignancy at any time t should be removed from the study and included in the analysis by means of the Kaplan-Meier renorm-alization procedure1 or the alternative procedure discussed in the preceding section. If the trial is to test the later response of patients to a short-term course of treatment (with or without following a continuous course of treatment), the time t = 0 is to be taken as the time at which the short-term course was completed, with only those patients who survived the short-term course included in the analysis. 5.2 The second criterion Linus Pauling and I examined more than 200 studies of survival of cohorts of 158 The Hardin Jones-Pauling Biostatistical Theory of Survival Analysis for Cancer Patients cancer patients, and we found that the Hardin Jones straight line for the semilogarithmic plot of survival as a function of time passes through the 100% point at time t = 0. An example of such a plot is shown in Figure 7. Accordingly, a meaningful clinical trial of the survival of cancer patients must be characterized by having the semilogarithmic plot of survival versus time have a line that passes through S = 100% at t =0. No statistically significant lag period in which no deaths happen can occur. A clinical trial producing a set of survival times with a significant lag period from t = 0, during which period the value of the death constant k would lead to the expectation that several deaths would occur, can be considered to be faulty. 5.3 The third criterion If the cohort is heterogeneous and the investigation properly carried out, with conditions constant during the period of the trial (the first criterion), then the semilogarithmic survival curve must bend away from the Hardin Jones initial straight line only in the direction of increased survival times for the longer-term survivors. Of course, this is to be expected since the subcohort of patients with shorter life expectancy is depleted, leaving the subcohort with longer life expectancy. An example of this is shown in Figure 8. The observation that the semilogarithmic plot of survival versus time bends downward as time increases indicates faulty design or execution of the clinical trial. This situation can occur if, after the death of many or most of the patients in the subcohort with high death rate, some of the survivors might have had their treatment changed in such a way as to increase the death rate. According to the First criterion, these patients should at the time of change of treatment been removed from the study. We have found a reported clinical trial that fails on each of these criteria for validity. This study is the well-publicized paper17 by Charles Moertel and his associates at the Mayo Clinic in Rochester, Minnesota reporting a clinical investigation that purports to investigate the efficacy of vitamin C in extending the lifetimes of patients with advanced colorectal cancer. An analysis of this paper will be presented in a forthcoming issue of this journal. One can also observe that the trial, analyzed in the foregoing, of the effectiveness of maintenance chemotherapy on the remission-free survival times of patients with acute myelogenous leukemia conducted by Embury et al.2,3 is somewhat doubtful because of the lag period observed for both the maintained and the non-maintained patients. Nevertheless, these lag periods in the Embury study could have arisen because of the small number of patients in the trial. 6. Conclusion In the foregoing, an alternative to the conventional method of survival analysis of clinical trials of cancer patients has been presented. This alternative, the Hardin Jones-Pauling biostatistical theory of survival analysis for clinical trials of cohorts of cancer patients, provides useful information, such as the death rate, not easily gleaned from the conventional theory. In particular, it has been shown how Pauling's contribution to this theory provides for the prediction of lifetimes of patients who have left the study prior to it conclusion and even to predict the lifetimes of outliers and that of a subcohort with a single member. It has also been shown how this theory naturally leads to the formulation of three criteria for the validity of clinical trials of cohorts of cancer patients. The application of this theory to an example from the literature that has been used in a textbook on survival analysis has been presented in detail. It is hoped that this presentation will encourage practitioners to utilize the theory in the analysis of their own clinical trials. Acknowledgments This work is dedicated to Abram Hoffer, M.D., Ph. D., F.R.C.P. (C), on the occasion of his eightieth birthday. It is largely due to the pio- 159 Journal of Orthomolecular Medicine Vol. 13, No. 3,1998 neering work of Dr Hoffer and also that of Irwin Stone that catalyzed Linus Pauling to initiate his work on vitamin C. I am grateful to Dr. Hoffer for asking me to write this article. I also thank Dorothy Bruce Munro and Jane Priddy Buechel for proofreading the manuscript. References 1. Kaplan EL, Meier P: Nonparametric estimation from incomplete observations. J Am Stat Assoc 1958;53:457-481. 2. Miller, Jr., RG: Survival analysis. New York. John Wiley & Sons. 1981; 238 pages. 3. Embury SH, Elias L, Heller PH, Hood CE, Greenberg PL, Schrier SL: Remission maintenance therapy in acute myelogenous leukemia. West J Med 1977; 126:267-272. 4. SAS* user's guide: statistics, Version 5 edition. Cary, NC. SAS Institute Inc. 1985: 530. 5. Miller JC, Miller JN, Statistics for analytical chemistry, 2nd edition. Chichester, England. Ellis Horwood Limited; New York. John Wiley & Sons. 1988; 63-64. 6. Cameron E, Pauling L: Cancer and vitamin C: discussion of the nature, causes, prevention, and treatment of cancer, with special reference to the value of vitamin C. Menlo Park, CA. Linus Pauling Institute of Science and Medicine. 1979; 238 pages. Updated and expanded edition: Philadelphia, PA. Camino Books, Inc. 1993; 278 pages. 7. Gompertz B: A sketch of an analysis and notation applicable to the estimation of the value of life contingencies. Philosoph Transact Royal Soc London, 1820; 110:214-296. 8. Gompertz B: On the nature of the function expressive of the law of human mortality, and on a new mode of determining the value of life contingencies. Philosoph Transact Royal Soc London, 1825; 115:513-585. 9. Gompertz B: A supplement to two papers published in the Transactions of the Royal Society. Philosoph Transact Royal Soc London, 1862; 152:511-559. 10. Jones HB: Demographic considerations of the cancer problem. Transact NYAS, 1956; Series 11,18: 298-333. 11. Burch PRJ: The biology of cancer: a new approach. Baltimore, MD. University Park Press. 1976; 452 pages. 12. Pauling L: How to live longer and feel better. New York. W. H. Freeman, 1986; 212ff. New York. Avon Books. 1987. 13. Cameron E, Campbell A: Innovation vs. quality control: an 'Unpunishable' clinical trial of supplemental ascorbate in incurable cancer. Med Hypoth, 1991; 36:185-189. 14. Byrkit DR: Elements of statistics: an introduction to probability and statistical inference. New York. Van Nostrand Reinhold Co. 1972; 217ff. 15. Pauling L: Biostatistical analysis of mortality data for cohorts of cancer patients. Proc Nat'l AcadSci, USA, 1989; 86:3466-3468. 16. Pauling L, Herman ZS: Criteria for the validity of clinical trials of treatments of cohorts of cancer patients based on the Hardin Jones Principle. Proc Nat'l AcadSci, USA, 1989; 86:6835-6837. 17. Moertel CG, Fleming TR, Creagan ET, Rubin J, O'Connell MJ, Ames MM: High-dose vitamin C versus placebo in the treatment of patients with advanced cancer who have had no prior chemotherapy. NEJM, 1985; 312:137-141. Editor's note: For nearly fifteen years, Dr. Herman was Professor Pauling's collaborator at the Linus Pauling Institute of Science and Medicine in Palo Alto, California. Together, they published many papers in the fields of theoretical chemistry, solid-state physics, and biostatistics. With Pauling's longtime assistant Dorothy Bruce Munro, he is the co-compiler of The Publications of Professor Linus Pauling (Internet site: http://charon.girinst.org/~zeke). | ||||||

This website is managed by Riordan Clinic
A Non-profit 501(c)(3) Medical, Research and Educational Organization
3100 North Hillside Avenue, Wichita, KS 67219 USA
Phone: 316-682-3100; Fax: 316-682-5054
© (Riordan Clinic) 2004 - 2024c
Information on Orthomolecular.org is provided for educational purposes only. It is not intended as medical advice.
Consult your orthomolecular health care professional for individual guidance on specific health problems.
 Download The Full Text Article in (PDF)